
02 Sep 2025

This week the Radius+ team is gearing up for SSA Las Vegas for the annual trade show to celebrate the 50th anniversary of the Self Storage Association.
This is the perfect time to have a backwards look at historical supply growth and see how it has affected the rental rates we’re tracking online.
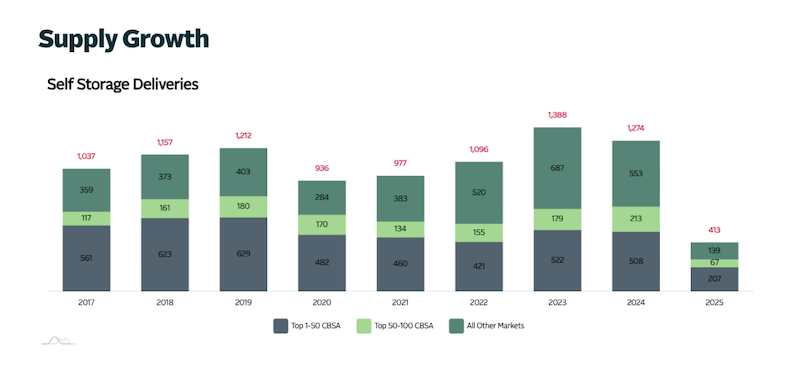
There was a great deal of supply added from 2017–2019 which was expected to have rates plummet as demand caught up with supply. However, the global pandemic caused by COVID-19 created a ton of temporary demand for Self Storage. This led to the asset class getting positive attention as it benefited from increased demand while other CRE asset classes like Office or Retail suffered from the stay at home policies created by COVID-19.
With rental rates soaring seasoned developers saw an opportunity to build new facilities, and many newcomers entered the industry as it was such an attractive asset to develop due to the unique conditions. This led to a massive bloat of new supply coming online in 2023 and 2024, where many deals penciled during 2020 and 2021 with high rental rates and less supply in lease up.
The music stopped in the past 2 years or so, with COVID-19 drivers subsisting and Americans not being mobile due to high interest rates making it an unattractive time to buy homes or upgrade homes as they would be taking on a much more expensive mortgage.
This perfect storm of oversupply and decreased demand has created a massive downward pressure on rental rates, with so many facilities attempting to lease up at the same time across the country, which has led to a much-needed slowdown in new supply added for 2025, a trend we are hopeful to see continue for at least another year.
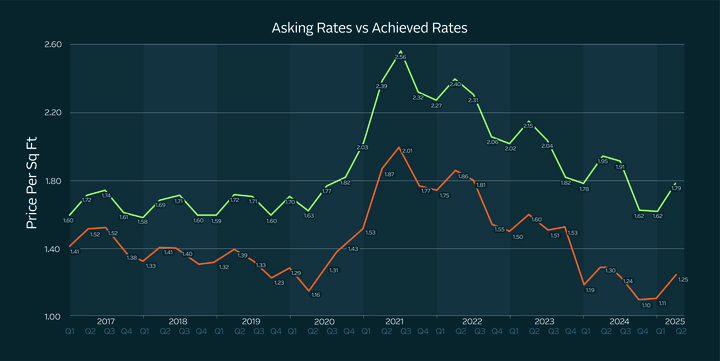
With rental rates seeming to start to rebound this year in Q2 2025, the Radius+ team is cautiously optimistic that we’ve hit the bottom in terms of demand and are starting to see signs of recovery.
Rates taken from 5x5, 5x10, 10x10, 10x15, 10x20 units CC, NCC rates from PUBLIC, CUBE, EXR