

31 Jul 2024
What are you: Developer, Owner, Flipper?
Build the Pipeline based on Region or Workflow so that you can set you eventually set Alerts and Exclusion
Click on the “+” sign and name the Portfolio: Examples: Qualified, Hit List, My Facilities
Add the address from the bottom or double click on the address
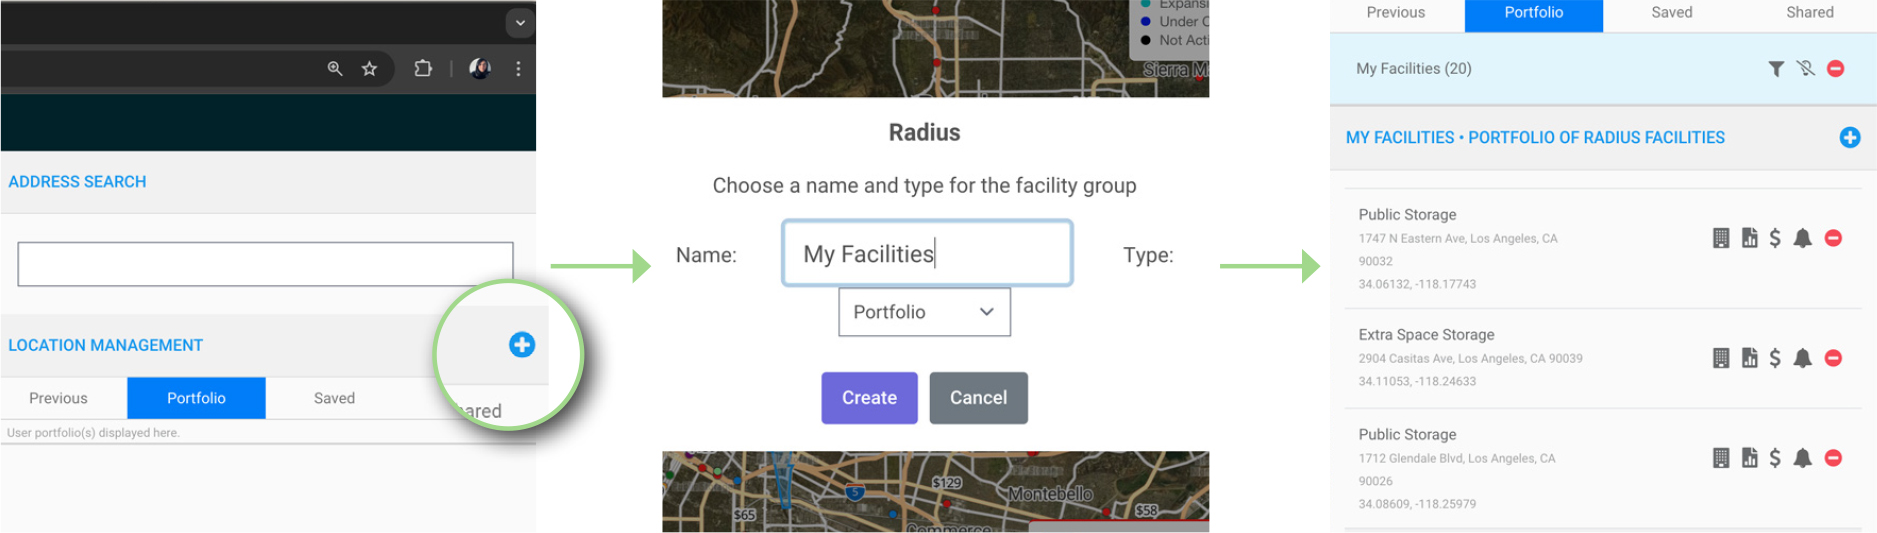

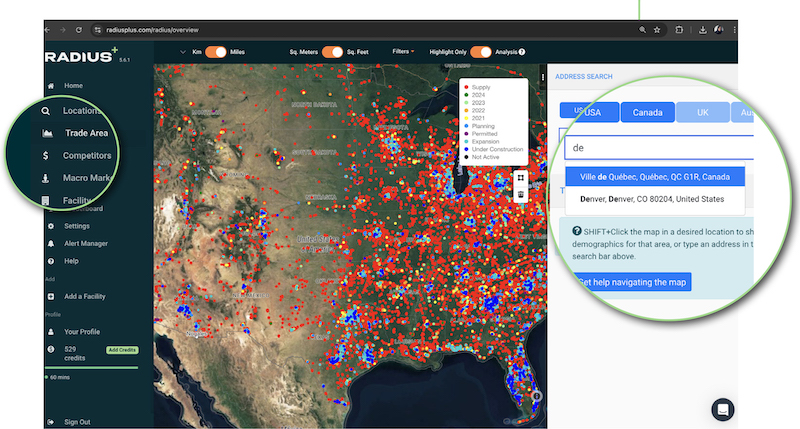
Put an address into the address field
Select address from ‘blue’ dropdown
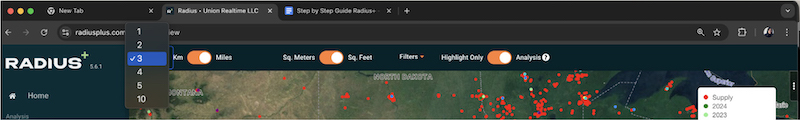
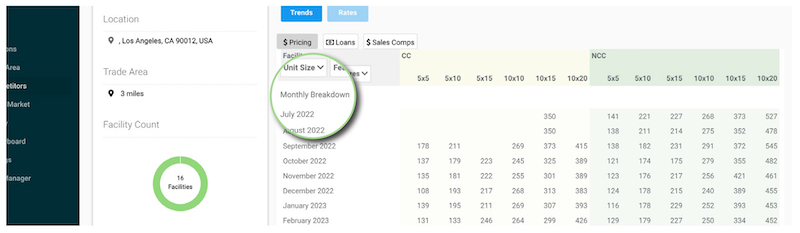
Here is where we define the Trade Area: 3 mile +
OR
Define by “Drive Time” press “D” and hit enter on keyboard
Click on the the “drive time” polygon that you choose - By color and Drive Time
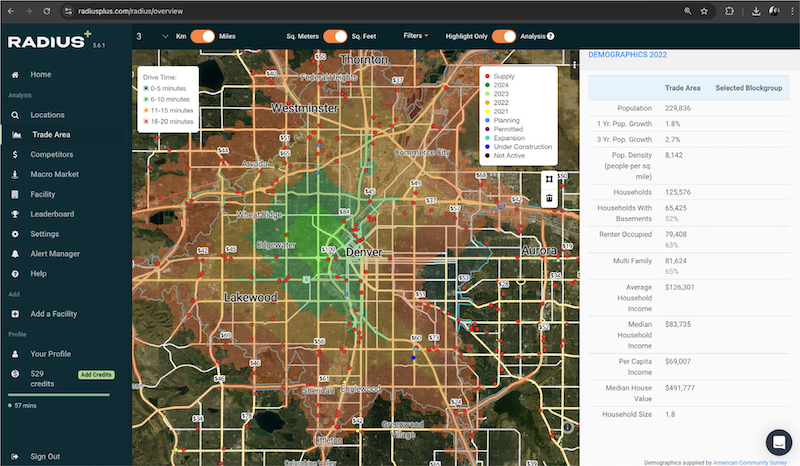
Panel on the Right Hand side reflects the data in your define ‘Drive Time” trade area
Look at Headings On Right:
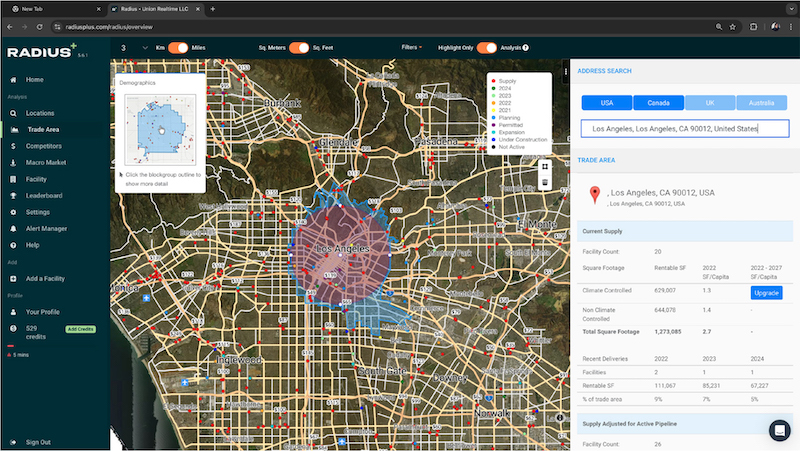
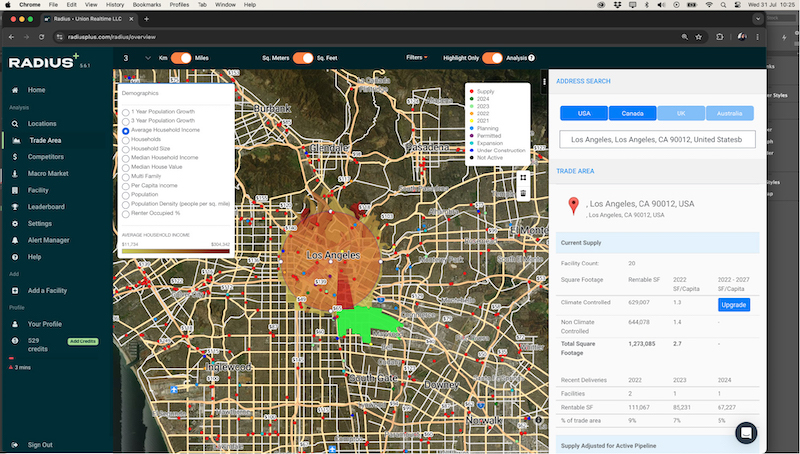
Check Demographics according to your defined criteria.
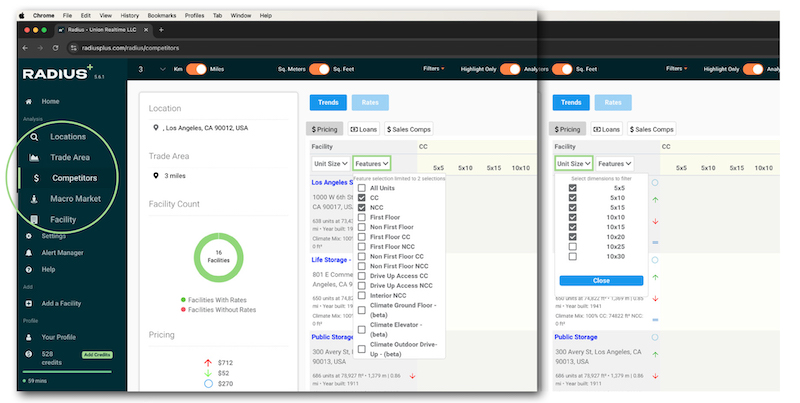
Go to: Competitors Page
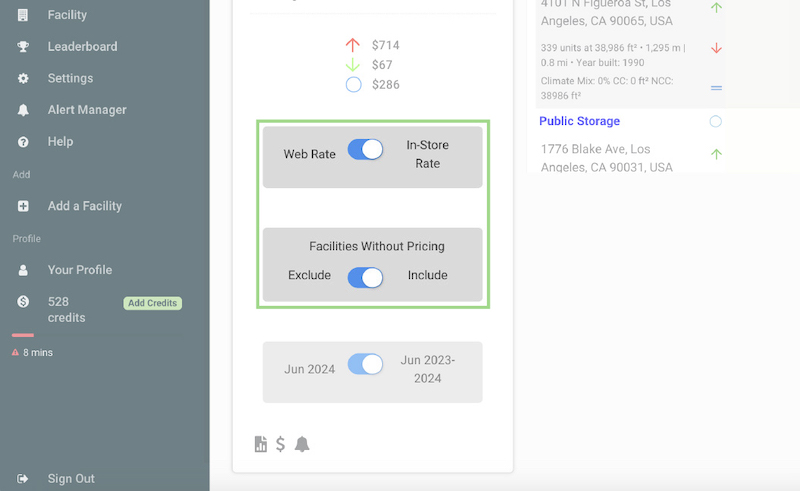
Make sure that on the middle column:
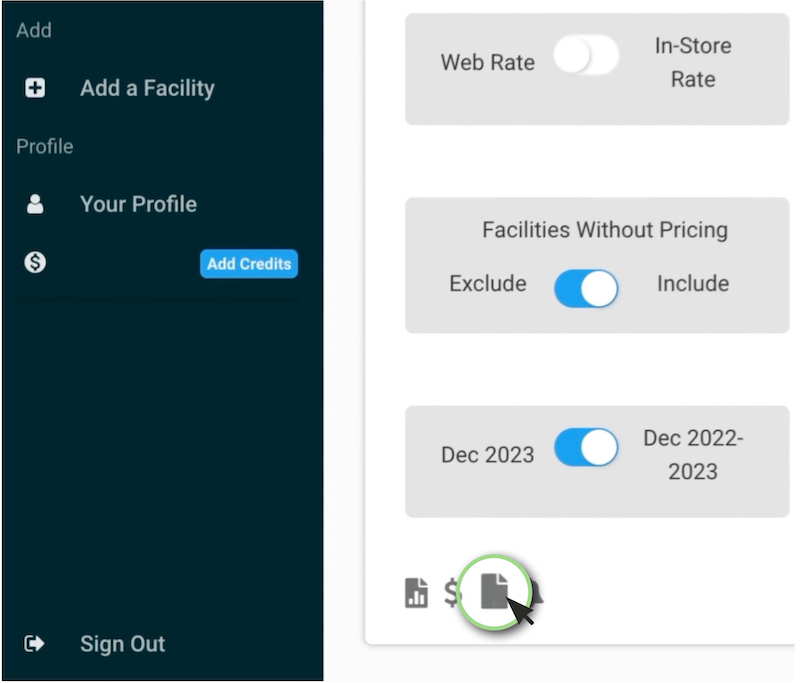
a. Web Rates
b. Facility w/o Price include
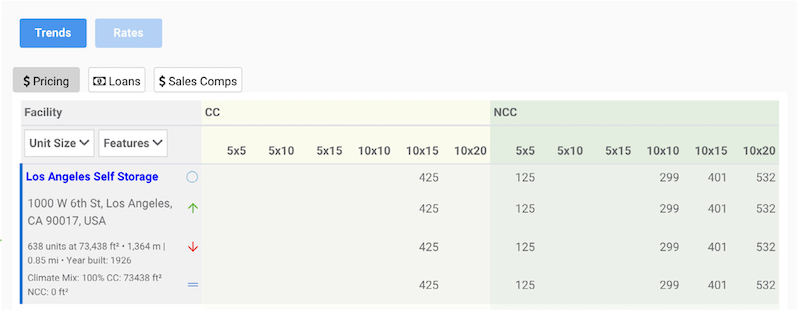
Go to: Features Dropdown arrow
Select: CC and NCC and if there are other features that interest you
Go to Unit Size
Select 5 unit sizes that are within your interest | 0 = 2 year Average | Green arrow = 12 month High | Red arrow = 12 month low | “=” is today’s scrapped rate
Scroll down to the “Monthly Breakdown”
Explains pricing trends over the last 2 years: demand trends | increase or
softening of asking rates | punchline is “Average Monthly Rent” at the bottom
This shows the 24 month trailing price averages of the entire trade area
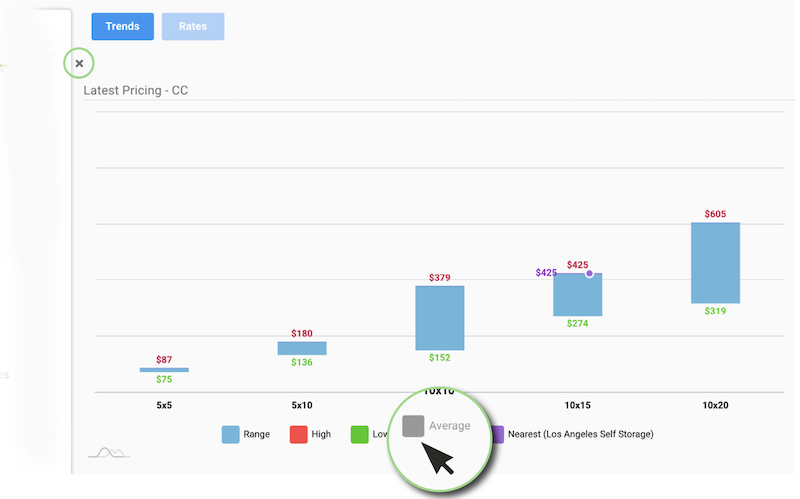
Click on Graphs to see visual breakdown
Let’s Download Excel Spreadsheets
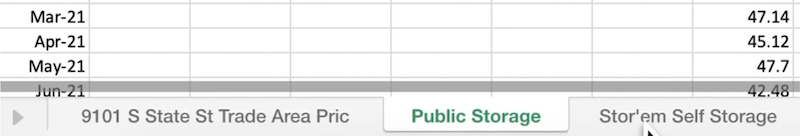
If you look at this weekly, you can spot trends early and not wait a month | Works in conjunction with Alerts. You can spot the exact prices, not just the average price.
Part II To Be Continued...