
03 Jun 2025

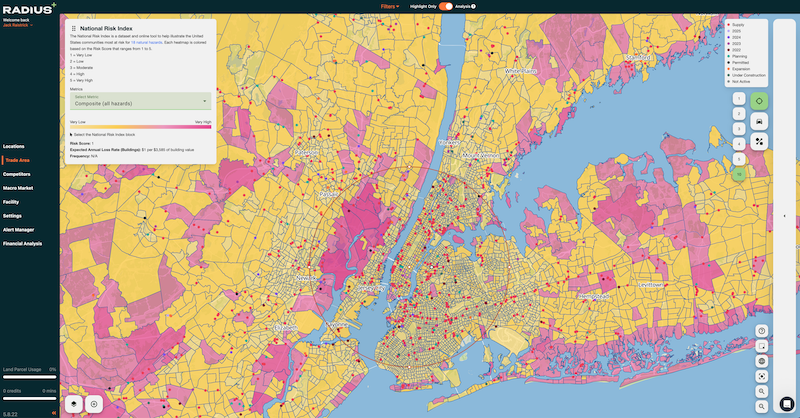
The Radius+ team is excited to announce our newest map layer - the National Hazard Risk index!
The National Risk Index is a dataset that illustrates the communities at risk for 18 natural hazards. The data is published annually by FEMA.
These natural hazards include:
1 = Very Low
2 = Low
3 = Moderate
4 = High
5 = Very High
Expected Annual Loss Rate: Expected Annual Loss Rate is a measure of relative natural hazard intensities independent of the community's exposure value. They represent the average percentage losses to buildings, population, and/or agriculture (consequence types) each year due to natural hazards.
Frequency: The expected frequency or probability of a hazard occurrence per year.
Risk Score: This score reflects a community’s overall risk of negative impacts from natural hazards. It’s rated on a scale from 1 to 5, with 1 indicating very low risk and 5 indicating very high risk.