
28 Mar 2023

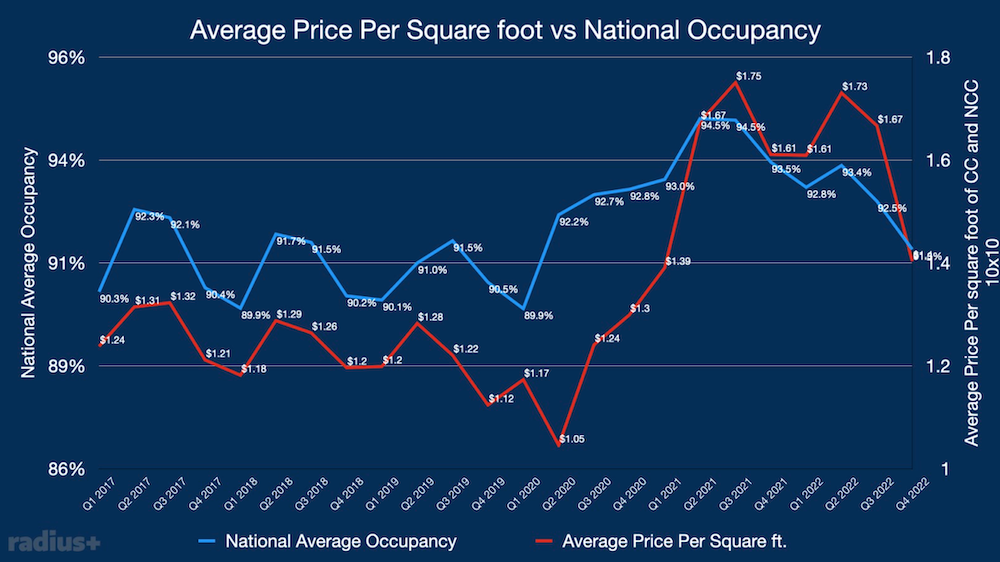
With Q1 2023 coming to an end we can look back at Q4 2022 Review to see how the self storage industry has been doing. The relationship between average price per square foot and occupancy is correlated, with higher occupancies being associated with a higher price per square foot. When a facility is close to full capacity, operators may charge a premium for the remaining units as there is a strong demand for it.
In Q4 2021 the average price per square foot was $1.61
In Q4 2022 Review the average price per square foot was $1.40
A 13% decrease YoY
In Q4 2021 the national average occupancy was 93.45%
In Q4 2022 Review the national average occupancy was 91.33%
A 2.26% decrease.
The drastic decrease in average price per square foot can be attributed to the fact that when facilities have an increase in vacancies, they often will offer price decreases for new move in’s to keep occupancy percentages high. While this keeps occupancy rates from ever dipping too low, it can take a while for average price per square foot to rise back up. If we see these numbers bounce back in Q1 of 2023 it could set a strong tone for the rest of the year, despite the challenging macroeconomic conditions.