12 Jul 2022

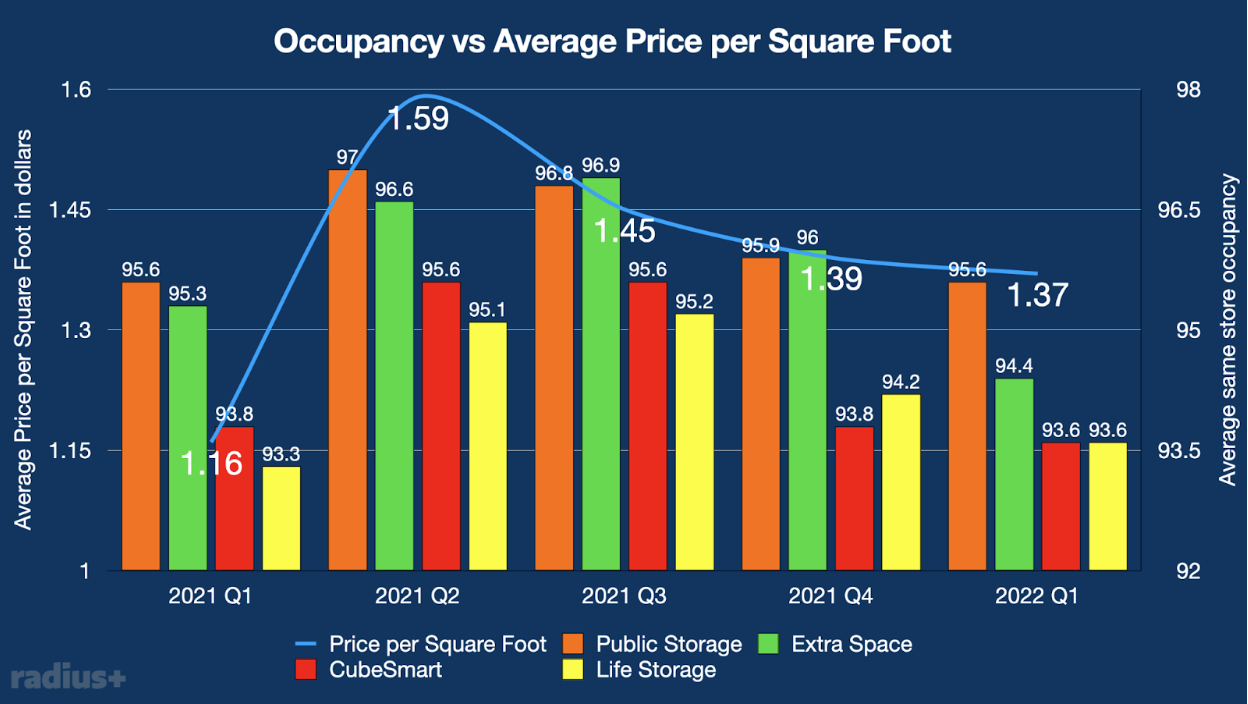
Observing the same store occupancy rates sourced from the REITs quarterly earning reports against the average price per square foot we are able to see that with higher occupancy rates there is also a higher price per square foot.
The peak in price per square foot was seen in Q2 of 2021 when occupancy was reaching an all time high, but started to go lower along with a marginal decline in occupancy rates.
The Radius+ team reported that in June 2021 the average price per square foot was $1.64 while in June 2022 the average price per square foot was $1.61 which is 1.8% less than the year before.
This is the first month of 2022 where the average price per square foot was lower in 2022 than it was in 2021. If this trend continues, and the average price per square foot of Q2 2022 is lower than average price per square foot of Q2 2021, it is likely that the Q2 2022 average same store occupancy will be lower than it was in Q2 2021.
*average price per square foot data based on 10x10 CC units from the top 4 REITs.
Average price per square foot sourced from Radius+.